Canadian Retail Sales Stumble at Modest Pace
By Retail Insider
31 OCT 2018 12:08:43
Canadian retail sales keep stumbling along at a modest pace, according to the latest Statistics Canada data. For the 3 months ending August, total Canadian retail sales were up 3.7% on a non-adjusted basis. This is about half the 7.1% gain recorded for last year overall.
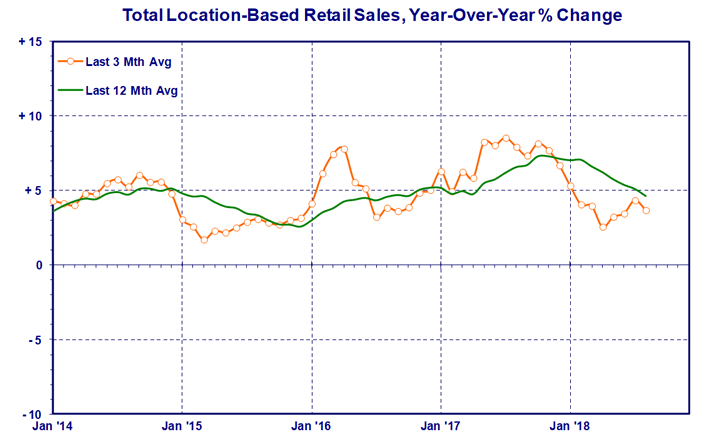
The 3 month growth trend (orange line in the chart above) continues to track below the underlying 12 month trend (green line), which in turn has been on a consistent slide since the start of the year. The upcoming 2018 holiday sales season doesn't look too promising at this stage.
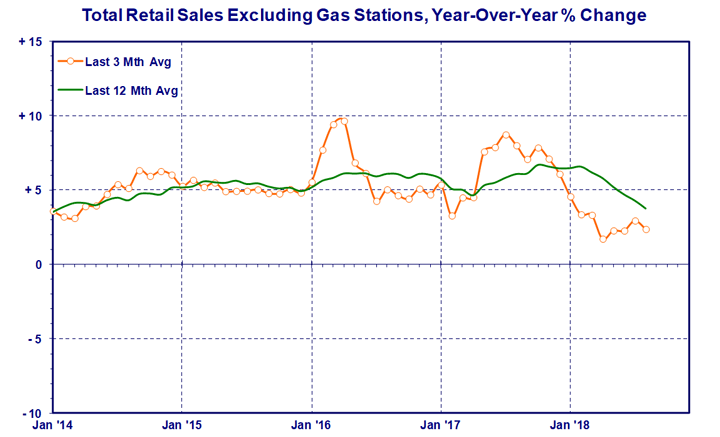
Rising gasoline prices are also masking the general deterioration in retail. For the first 8 months or 2/3 of 2018, year-to-date retail sales were up 3.6% with gas stations included, but up only 2.6% when gas stations are excluded. In other words, gas price increases are adding a full percentage point to total retail sales growth than would otherwise be the case. The chart below shows the trends without gasoline stations, and this betrays an even steeper slide in retail sales growth in 2018.
Food & Drug
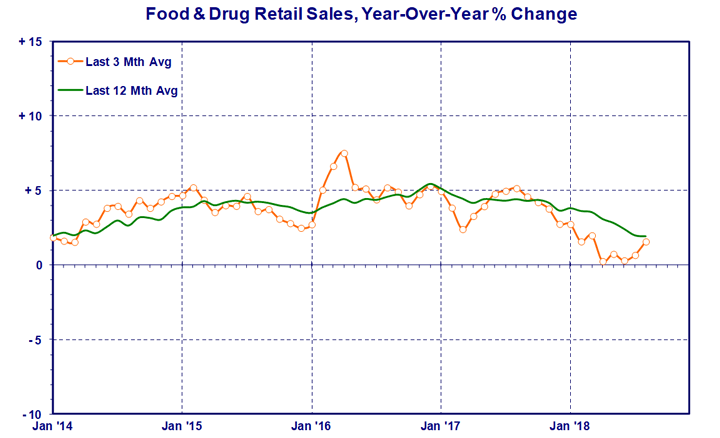
The Food & Drug sector has had a tough time so far in 2018. Retail sales are up only 1.2% year-to-date to August 2018, after 2/3 of the year. While the 3 month growth trend (orange line) has had a small uptick lately, it is still at a relatively low point. The underlying 12 month trend (green line) weakened last year and this has become an even steeper descent so far in 2018.
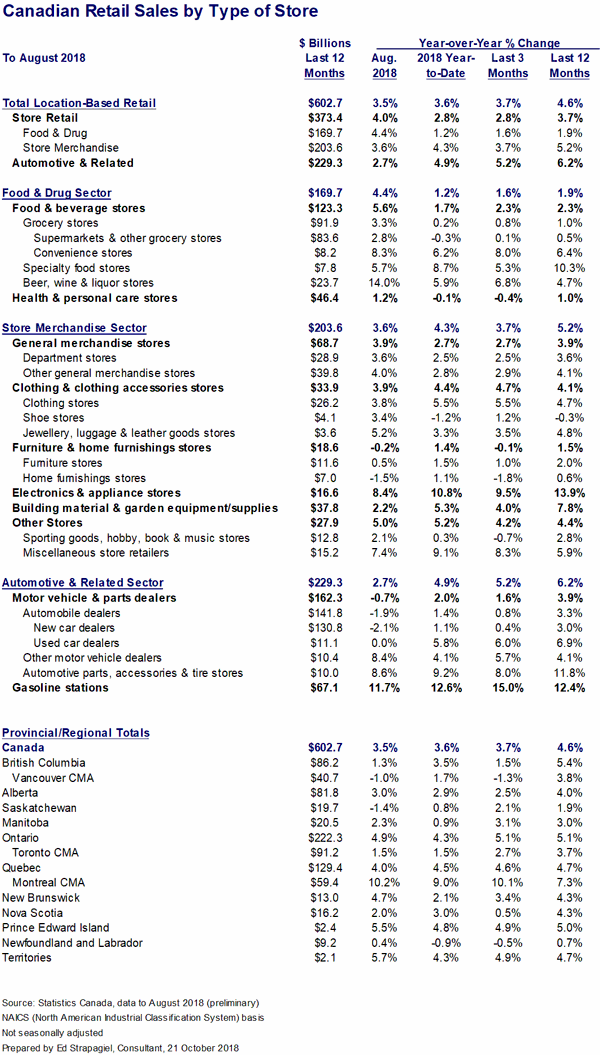
Just over 75% of the sales in this sector are in two store types, both of which have experienced actual retail sales declines thus far in 2018. Supermarkets & other grocery stores' sales were down 0.3% after 8 months of the year, while health & personal care stores were down 0.1%. Mama, don't let your babies grow up to be grocers or pharmacists.
The smaller store types in the Food & Drug sector however are doing comparatively well. Specialty food stores, convenience stores, and beer, wine & liquor stores are all up 5% or better year-to-date.
Store Merchandise
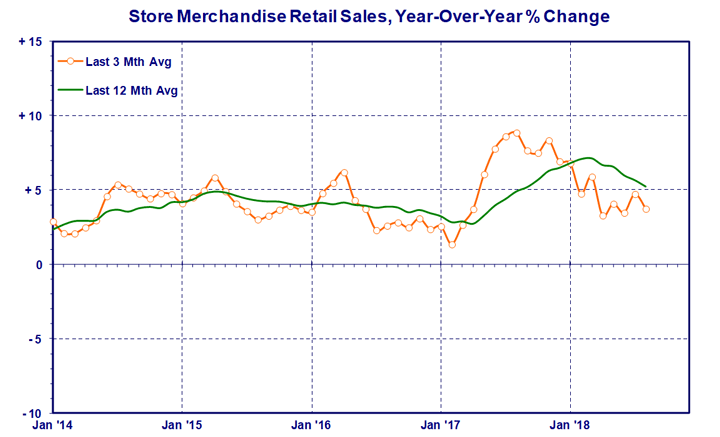
Retail sales growth in Store Merchandise is higher than for the Food & Drug sector. After 8 months of 2018, the Store Merchandise sector's retail sales were up 4.3%, which however represents a decline from the 6.5% annual growth recorded for 2017. Nevertheless, current retail sales growth levels are in line with prior years.
The 3 month growth trend (orange line in the chart above) has steadied since about Q2 2018. After a remarkable run in 2017, the underlying 12 month trend (green line) has declined, but should stabilize by the end of the year.
Electronics & appliance stores continue to do well, with retail sales up 10.8% after 8 months of 2018. The murky miscellaneous store retailers also recorded an above average 9.1% year-to-date sales increase, while clothing stores gained a respectable 5.5%.
On the other hand, retail sales at shoe stores are down 1.2% year-to-date thus far in 2018, and sporting goods, hobby, book & music stores barely got ahead with a 0.3% gain.
Note that Statistics Canada is now suppressing the breakdown of general merchandise stores for confidentiality reasons. The figures in the table below are estimates based on previous trends.
Automotive & Related
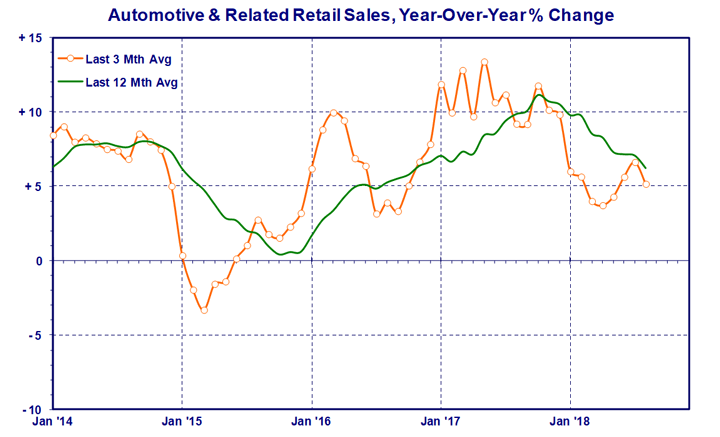
When gas prices go up at the same time as when new vehicle sales are hot, the Automotive & Related sector booms. This was the case last year, in 2017. But this started to change late last year when new car dealers' retail sales hit the brakes. After 8 months or 2/3 of 2018, year-to-date sales at automobile dealers are up only 1.4%.
Gasoline stations, on the other hand, made up for a big portion of this. Their year-to-date retail sales are up 16.8%. It's all due to higher gas prices at the pump however, not because of drivers somehow wanting to buy that much more fuel for their vehicles. Gasoline prices are now stabilizing however, and retail sales gains are likely to flatten out. This in turn will bring down overall total retail performance statistics.
By The Numbers
Special Note: Statistics Canada has made updates to 2017 numbers, and has also moved retail storefronts of telecom companies out of electronics & appliance stores and into a non-retail category, Telecommunications (NAICS 513). Retail trade statistics have been revised back to January 2012.
Canadian E-Commerce Sales
StatsCan started providing ecommerce retail sales data in January 2016. While the amount of data is limited, some trends appear to be emerging. Here are some results.
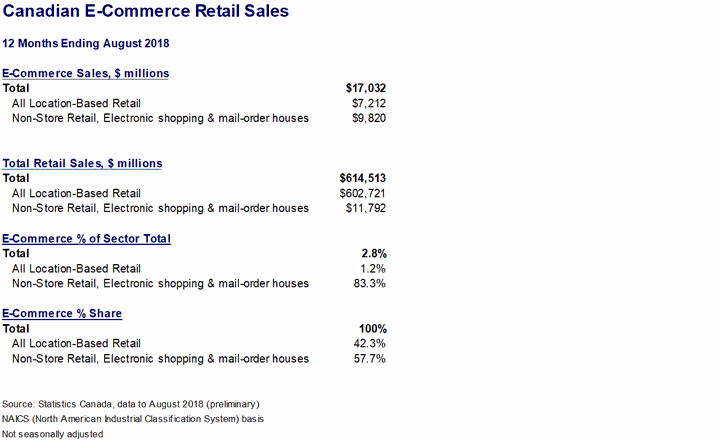
Overall, e-commerce represented about 2.8% of total Canadian retail sales for the 12 months ending August 2018, including both pure play operators as well as the online operations of brick & mortar stores. Canadian consumers however also buy online from foreign websites which is not captured in these numbers.
Canadian e-commerce sales were up 13.5% year-over-year for the 3 months ending August 2018, but this is much less than the 3.9% gain recorded in the same period a year ago. E-commerce retail sales gains are still in double digits, and are still much higher than for location based retail, but growth is slowing down.
Note that location based retail is the same as that in the preceding large "By The Numbers" table. It's what's normally reported as Canadian retail sales. Except that it isn't. Location based retail excludes another section called Non-Store Retailers (NAICS code 454), which includes electronic shopping and mail-order houses, which in turn is where (mostly) pure play e-commerce businesses are. For the 12 months ending August 2018, electronic shopping and mail-order houses had an estimated $9.8 billion in e-commerce sales.